Core Web Vitals explained: LCP, INP and CLS, and how to check them

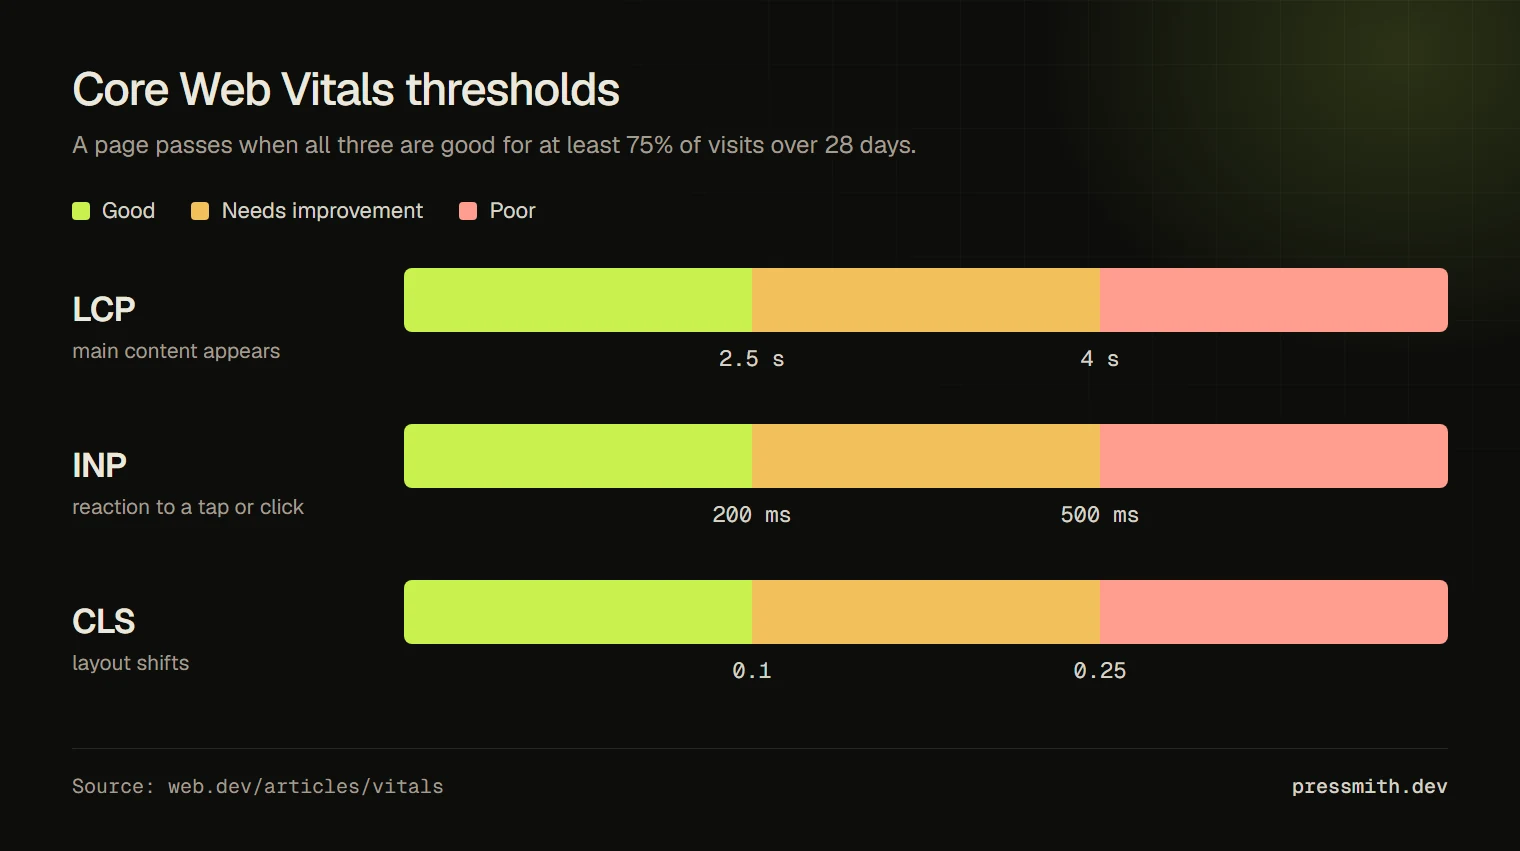
Core Web Vitals are three Google metrics that describe how a page feels to a real visitor: how fast the main content appears (LCP), how quickly the page reacts to a tap or click (INP), and whether the layout jumps while it loads (CLS). A page passes when all three are in the “good” range for at least 75% of visits. Below is what each metric means, the exact thresholds, and how to check your own site in a minute.
Want to see your numbers right away? Run a free website audit: it shows Core Web Vitals from real Chrome users and a lab test for mobile and desktop in one report.
The three metrics and their thresholds
| Metric | What it measures | Good | Needs improvement | Poor |
|---|---|---|---|---|
| LCP, Largest Contentful Paint | When the biggest image or text block on the first screen is shown | up to 2.5 s | 2.5–4 s | over 4 s |
| INP, Interaction to Next Paint | How long the page takes to respond to taps, clicks and key presses | up to 200 ms | 200–500 ms | over 500 ms |
| CLS, Cumulative Layout Shift | How much visible content moves unexpectedly while the page is used | up to 0.1 | 0.1–0.25 | over 0.25 |
Google judges each metric at the 75th percentile of page loads over the last 28 days, separately for mobile and desktop. In practice: if three visitors out of four get a good LCP, the page passes on LCP. INP replaced the older FID metric in March 2024, so guides that still talk about FID are out of date.
Lab data and field data are not the same thing
There are two ways to measure speed, and most confusion comes from mixing them up.
- Field data is what real Chrome users experienced on your site over the last 28 days. Google collects it in the Chrome UX Report (CrUX). This is what Search uses for page experience, and this is where the Core Web Vitals assessment comes from.
- Lab data is one test run by Lighthouse in a controlled environment: a simulated mid-range phone on a throttled connection. It is great for finding causes, but it is a single run, so the score can move a few points between tests.
Small and new sites often have no field data at all: Chrome needs enough visits before it publishes numbers. In that case you only see lab data, and that is normal. Total Blocking Time (TBT) from the lab is the closest stand-in for INP.
How to check your Core Web Vitals
- A full audit in one place. Our website audit runs Google PageSpeed for mobile and desktop, shows field data when it exists, and lists the specific opportunities with their estimated savings.
- PageSpeed Insights. Google’s own tool at pagespeed.web.dev shows the same CrUX data and a Lighthouse run for one URL.
- Search Console. The Core Web Vitals report groups your URLs into good, needs improvement and poor, based on field data. It is the best view of the whole site once you have traffic.
- Chrome DevTools. The Performance panel shows LCP, INP and CLS live while you click through the page, which helps to find the exact element at fault.
What usually breaks each metric
LCP: the main content appears late
- A heavy hero image or slider: large files, no modern format, no
widthandheight. - The LCP image is lazy-loaded.
loading="lazy"on the first-screen image delays it on purpose; remove it there and considerfetchpriority="high". - Slow server response (TTFB): no page caching, slow hosting, heavy plugins.
- Render-blocking CSS and JavaScript, and web fonts that hide text until they load.
INP: the page reacts slowly
- Too much JavaScript running on the main thread: page builders, sliders, chat widgets, tag managers with many tags.
- Long tasks after a click, such as heavy analytics events or filters that re-render the whole page.
- Third-party scripts. Every extra domain costs a connection and often main-thread time.
CLS: the layout jumps
- Images, video and iframes without dimensions, so the browser does not reserve space for them.
- Cookie banners, promo bars and ads inserted above existing content.
- Web fonts that swap in with different metrics and push the text around.
Fixes that work on most WordPress sites
- Turn on page caching (a caching plugin or server-level cache) and make sure the hosting runs a current PHP version.
- Serve images in WebP or AVIF at the size they are shown, with
widthandheightset. Check that the server or CDN really returns the modern format, not only that the file name says so. - Do not lazy-load the first-screen image; lazy-load everything below it.
- Remove plugins and scripts you do not use, and load chat and marketing widgets only after interaction or on the pages that need them.
- Preload the main font, use
font-display: swap, and keep the number of font files small. - Reserve space for banners, embeds and ads so nothing pushes content down after it appears.
What it looks like in the HTML:
<!-- First-screen image: no lazy loading, high priority, fixed size -->
<img src="/hero.webp" width="1200" height="630" fetchpriority="high" alt="…">

<!-- Images further down the page -->
<img src="/photo.webp" width="800" height="600" loading="lazy" alt="…">

<!-- Main font: preload it and show text while it loads -->
<link rel="preload" href="/fonts/inter.woff2" as="font" type="font/woff2" crossorigin>
<style>
  @font-face {
    font-family: "Inter";
    src: url("/fonts/inter.woff2") format("woff2");
    font-display: swap;
  }
</style>
After changes, run the audit again for the lab result right away. Field data updates gradually: give it up to 28 days to fully reflect the improvement.
Frequently asked questions
Do Core Web Vitals affect Google rankings?
They are part of Google’s page experience signals. Relevance of the content still matters much more, but between pages of similar quality a faster, more stable page has an advantage, and it converts visitors better regardless of rankings.
Why is my PageSpeed score different every time?
The score comes from a single lab test, and network and server conditions change between runs. Look at the trend and at the field data rather than at one number.
My site has no field data. Is that a problem?
No. Chrome publishes field data only when a site has enough visits. Until then, use the lab metrics, especially LCP and TBT, as your guide.
What is a good PageSpeed score for mobile?
90 and above is rated good. Many business sites score 50–89 on mobile because the test simulates a mid-range phone on a slow connection; the Core Web Vitals assessment from field data matters more than the score itself.
Check your site now
Paste your address into the free website audit. In about a minute you get Core Web Vitals for mobile and desktop, a list of what slows the page down with estimated savings, and a prioritized improvement plan you can export to Jira or Trello. Sources: web.dev: Web Vitals, Google Search Central: Core Web Vitals.